add additional detail to the stored object for a graph
AugmentMethod.RdCreates the necessary details that feed into the text descriptions in the VI() function and into the descriptions used in the accessible online versions of the graphs.
Examples
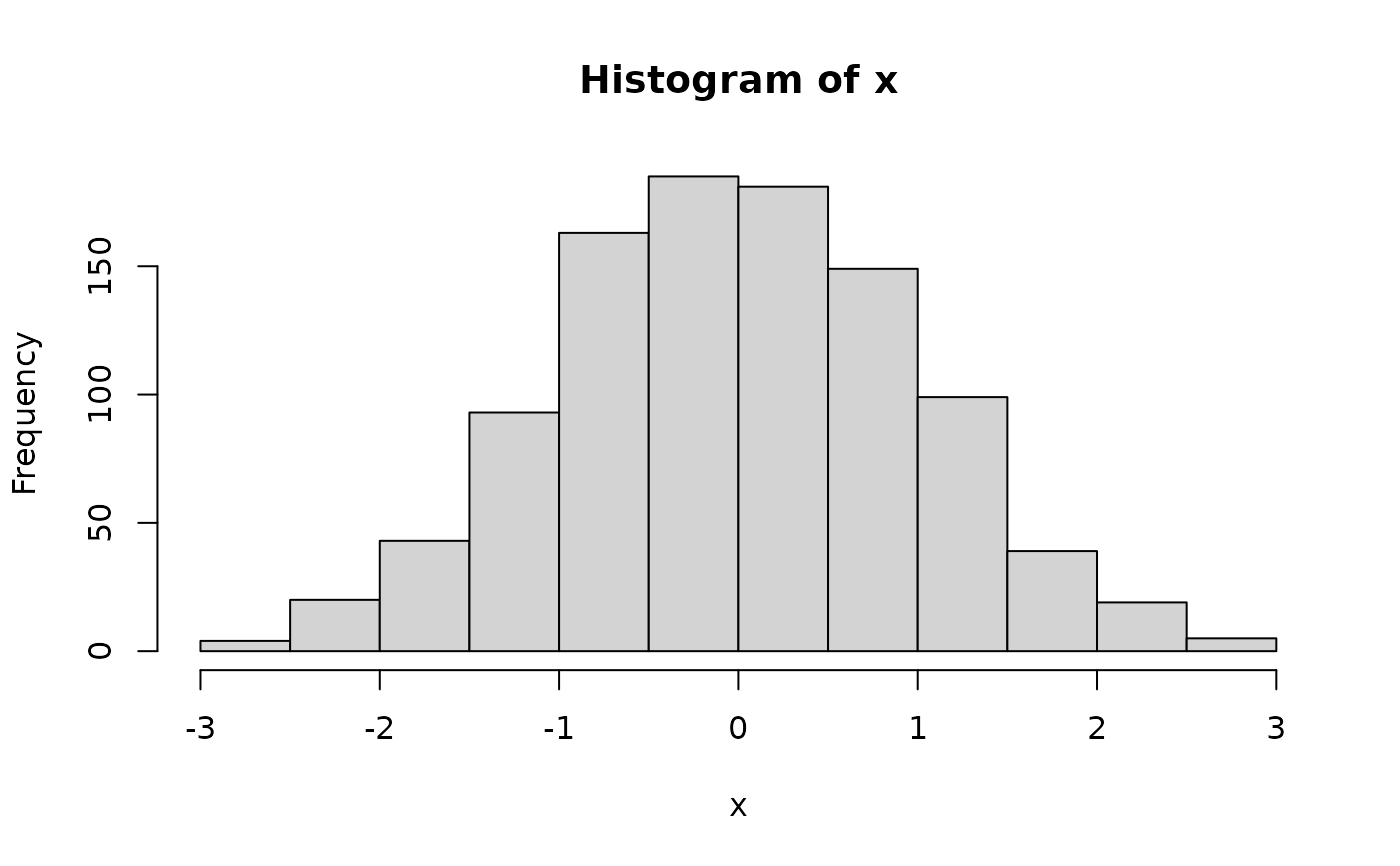
x=rnorm(1000)
MyHist=Augment(hist(x))

MyHist
#> $breaks
#>  [1] -3.0 -2.5 -2.0 -1.5 -1.0 -0.5  0.0  0.5  1.0  1.5  2.0  2.5  3.0
#>
#> $counts
#>  [1]   4  20  44  93 163 184 181 149  99  39  19   5
#>
#> $density
#>  [1] 0.008 0.040 0.088 0.186 0.326 0.368 0.362 0.298 0.198 0.078 0.038 0.010
#>
#> $mids
#>  [1] -2.75 -2.25 -1.75 -1.25 -0.75 -0.25  0.25  0.75  1.25  1.75  2.25  2.75
#>
#> $xname
#> [1] "x"
#>
#> $equidist
#> [1] TRUE
#>
#> $ExtraArgs
#> $ExtraArgs$main
#> [1] "Histogram of x"
#>
#> $ExtraArgs$xlab
#> [1] "x"
#>
#> $ExtraArgs$ylab
#> [1] "Frequency"
#>
#> $ExtraArgs$sub
#> [1] ""
#>
#>
#> $NBars
#> [1] 12
#>
#> $par
#> $par$xaxp
#> [1] -3  3  6
#>
#> $par$yaxp
#> [1]   0 150   3
#>
#>
#> $xTicks
#> [1] -3 -2 -1  0  1  2  3
#>
#> $yTicks
#> [1]   0  50 100 150
#>
#> attr(,"class")
#> [1] "Augmented" "histogram"